2017 began with flat rents on a total and per square foot basis. Rents remained constant at 76¢ per square foot from the prior month and average total rents fell $7 to $1082 between the first month of 2017 and December of last year.
This overview utilizes NTREIS data on leased properties in Abilene, Texas. This data provides 13 months of data spanning January 2016 to January 2017, allowing the user to look across these months at changes in rental prices, days on market and inventory available town wide, both by school district and by ZIP code. The percentage changes calculated in this table compare the current month’s statistics to an average of the last 12-months and the data from the same month in the 2016.
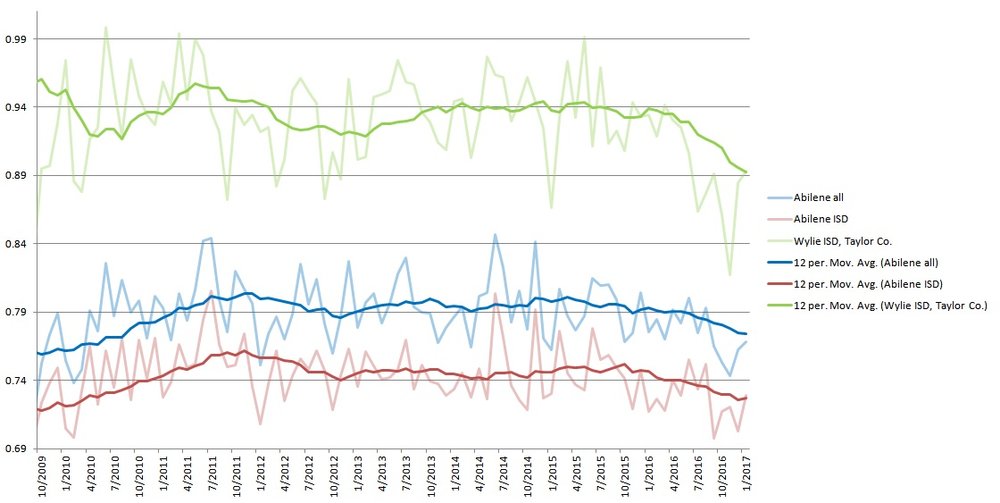
To gain deeper historical insight into the Abilene rental market, NTREIS data from October 2008 forward was used to look at rental market trends. To enable comparability, the Consumer Price Index for housing was used to adjust for inflation over this period. A 12-month moving average was used to smooth monthly variations.
Looking back at the 12-month moving average for rent since October 2009, we see rents increase to until winter of 2012, fall slightly and then stabilize until decreasing as we enter 2016. The 12-month average of Wylie ISD rents reveals Wylie ISD experiences more variation, but by the end of 2013, the stability in rents mirrors that of Abilene ISD. Like AISD, 2016 brings declining rent per square foot for Wylie rentals.
12-MONTH AVERAGE OF RENT PER SQFT, OCTOBER 2008 TO JANUARY 2017

A 12-month average of the number of days on the market was used to assess the Abilene rental market. Currently, Abilene ISD and Wylie ISD rentals lease at roughly the same pace. It took 36 days to find a renter in Wylie ISD and 37 days to find a renter for an Abilene ISD rental.
12-MONTH AVERAGE OF DAYS ON MARKET, OCTOBER 2008 TO JANUARY 2017

Also captured by this data is the steady climb in the number of days on the market for rentals. Over the past few months, this column has addressed the growing vacancy rate experienced by landlords. To contextualize growing vacancies over a longer period we can see that other months have experienced similar pace when leasing.
In January 2017, Abilene homes spent 51 days on the market. Abilene ISD homes spent 55 days on the market while Wylie ISD homes leased 14 days faster or 41 days on the market. In a reversal from last month, the 14 homes leased in 79603 in January 2017 fared the worst. These homes were empty an average of more than two months (64 days) before a tenant was found.
Lower rents per square foot and longer time on the market are consistent with research our brokerage has done on the expansion of rentals following the economic downturn in 2007. Historically low interest rates since 2009 made rentals more appealing as a method of diversifying an investor’s portfolio. As landlords entered the market or expanded their holdings, it only stands to reason that the response would be lower rents and longer vacancies.
Security deposits, a measure of rental quality, fell $27 from last month. This drop still marked a 2.4% gain when compared to the 12-month average. Pet deposits between December and January fell 1.6% against the 12-month average with a 3% gain in the number of rentals leased to pet owners.
Since 2009, the 12-month average of inflation-adjusted deposits have increased in Abilene and for rentals in the Abilene ISD. The 12-month average for security desposits collected on homes in the Wylie ISD display more variation. Wylie ISD deposits reach a peak in the fall of 2012, decline until the fall of 2014 and then slowly begin to make a recovery that is blunted as Wylie ISD rentals enter 2017.
12-MONTH AVERAGE OF TOTAL SECURITY DEPOSITS,OCTOBER 2008 TO JANUARY 2017

According to NTREIS, 100 single-family homes were leased in December 2016. These units leased at, on average, 76₵/square foot and were sized at 1,454 square feet. Consequently, these leases are estimated to deliver a January 2017 value of $110,504 to the Abilene economy. Considering the coming 12 months and the leases executed during January 2017, these leases potentially account for a $1,326,048 annual contribution to Abilene’s economy.

Leave a Reply