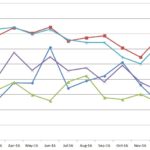
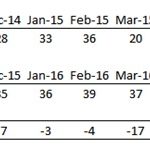
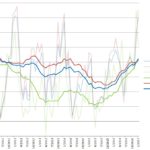
2017 began with flat rents on a total and per square foot basis. Rents remained constant at 76¢ per square foot from the prior month and average total rents fell $7 to $1082 between the first month of 2017 and December of last year. This overview utilizes NTREIS data on leased properties in … Continue reading...
December 2016 Rental Report
In retrospect, 2016 ended with lower rent per square foot when compared to December 2015. Rents in the December 2016 matched the annual average of 76¢ per square foot and were 1¢ less per square foot than realized one year prior. This overview utilizes NTREIS data on leased properties in … Continue reading...
November 2016 Rental Report
For the first time in 14 months, Abilene rentals leased faster than the same month in the prior year. November 2016 homes leased in 35 compared to November 2015 rentals that leased in 36 days yielding a tepid 1-day difference. This overview utilizes NTREIS data on leased properties in Abilene, … Continue reading...
October 2016 Rental Report
October 2016 rents remained flat at 75¢ per square foot and were 1¢ below the twelve-month average for Abilene area rentals. This is better news than fall 2015 when rents fell 3¢ per square foot between September to October in 2015. This overview utilizes NTREIS data on leased properties in … Continue reading...
September 2016 Rental Report
Continuing a 13-month streak, Abilene homes leased slower when contrasted to market absorption in the same month from the prior year. Over the last four months, homes stayed on the market longer and September 2016 rentals sat, on average, for 37 days before a lease was struck. This overview … Continue reading...
August 2016 Rental Report
Since June 2016, Abilene rentals remained on the market longer without an occupant. This trend was seen in both the Wylie ISD and Abilene ISD and the pace was driven by north side and far south side rentals. This overview utilizes NTREIS data on leased properties in Abilene, Texas. This data … Continue reading...
July 2016 Rental Report
July 2016 brought lower rents and smaller pet deposits, but continued the five-month trend of steadily increasing security deposits for leased single-family homes. This overview utilizes NTREIS data on leased properties in Abilene, Texas. This data provides 13 months of data spanning July 2015 to … Continue reading...
June 2016 Rental Report
For five straight months, Abilene rentals have spent less time on the market. In, February 2016, rentals spent an average of 39 days on the market and this has steadily declined to 24 days on the market realized in June 2016. This overview utilizes NTREIS data on leased properties in Abilene, … Continue reading...
May 2016 Rental Report
May 2016 continued a four-month trend of diminished vacancy for rent houses awaiting a tenant. February 2016 rentals spent an average of 39 days on the market and this has steadily declined to 33 days on the market seen in May 2016. Still, this is 3 days above the 12-month average of 30 days that … Continue reading...
April 2016 Rental Report
In April 2016, rents rose in each zip code in Abilene. Compared to the March, rent rose 3¢ to 77¢ per square foot, adding $45 to rent to the average, 1504 square foot rental. This gain marks a 3.2% increase in rent over the twelve-month average and a 6.2% gain over rent/square foot in April … Continue reading...