by John Hill
Barnett & Hill brings you 11 years of real estate data on single-family homes sold in the Abilene market. New to this year’s analysis is data for Jim Ned Consolidate ISD (JNCISD). New bond elections and development in JNCISD will make sales data for this school district interesting to watch in the coming years.
A few highlights from 2016:
- 1,771 homes were sold in Abilene proper (+95 from 2015, 10.5% gain) . Not necessarily matching Abilene’s boundaries were sales by school district. 1,081 homes (+33 from 2015 for a 3.1% gain) were sold in AISD, 706 homes (+67 from 2015 for a 10.5% gain) were sold in WISD and 67 homes (+21 from 2015 for a 45.7% gain) were sold in JNCISD.
- The most expensive sale for the Abilene area was $970,000 in JNCISD (and in case you were wondering about the transaction for 1109 Bell Plains, this deal was classified as Residential-Farm & Ranch. The data tabulated here only considers transactions for Residential-Single Family)
- With 1,771 homes sold in 2016, the city of Abilene saw the largest number of sales when compared to its performance over the last 11 years. 2015 was the next-best year in terms of single-family homes sold.
- List price is the original advertised price. Close price is the price for which the house ultimately sold. The difference between these is part of the seller’s concessions to get the deal booked. Seller contributions are for things like home warranties or repairs – these are added to total concessions. Homes in JNCISD made the greatest concessions (-$7,404) but homes in this district were the most expensive with a close price of $248,657. Homes in Abilene ISD conceded the least (-$5857), but homes in this district were the most inexpensive with a close price of $126,109.
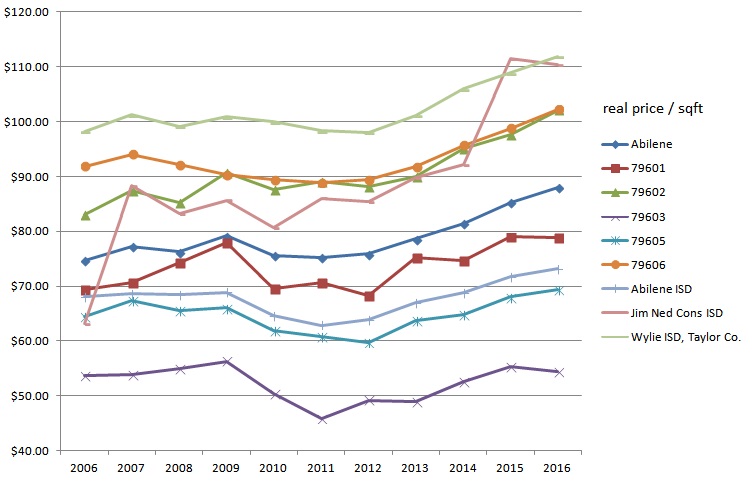
- Between the 5 Abilene ZIP codes, 79606 and 79602 sell for the most/sqft ($102.25 and $102.09, respectively). Homes in 79603 sell for the least at $54.36 and is the only ZIP code to experience a fall in $/sqft (-64 ¢/sqft) between 2015 to 2016.
- Of the three school districts considered, WISD homes sell for the most per sqft ($111.92) and edge JNCISD by $1.59 to earn this claim. AISD homes sold for $73.15 in 2016.
- One can’t take price/sqft by school district in isolation – WISD and JNCISD homes sell for more per square foot because, on average, they are newer. The average WISD sale was 13 years old and the average JNCISD sale was 19 years old compared to the average AISD sale aged at 50 years.
- The average JNCISD home is 101 sqft larger than the average WISD home. The average WISD home is 360 sqft larger than the average AISD home. Again, the age of the inventory across the 3 school districts help explain this – homes have grown larger across time.
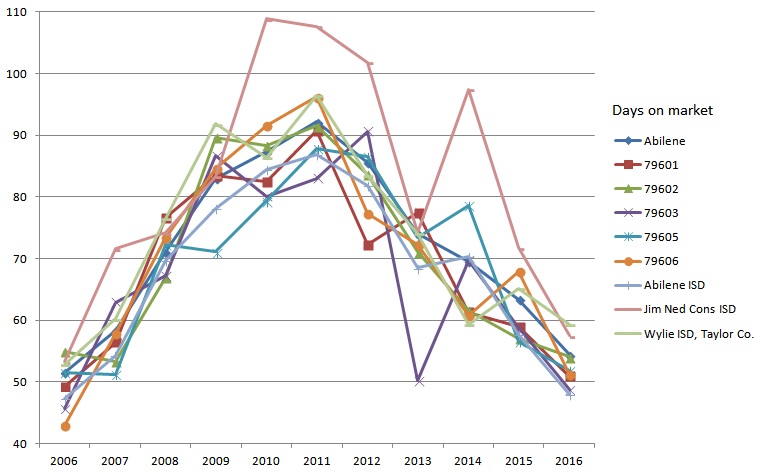
- Homes in AISD sold 11 days faster than homes in WISD. With the exception of 2014, this trend has held true for the last 11 years.
- Homes in JNCISD sold in 57 days – 9 days slower than sales in AISD. This pace is comparable to the rate at which JNCISD homes sold in 2006 and roughly cuts time on market in half when compared to JNCISD performance in 2010.
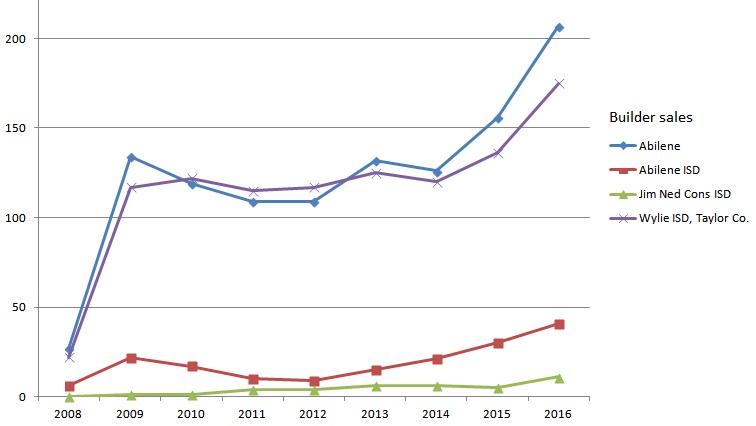
- Builder-sold homes were slightly larger in AISD (+50 sqft) and JNCISD (+26 sqft) when compared to builder-sold homes for these districts 2015. Builder-sold homes in WISD were slightly smaller (-109 sqft) than last year. New built homes in AISD were smaller than builder-sold homes in WISD (+441 sqft) and JNCISD (+576 sqft).
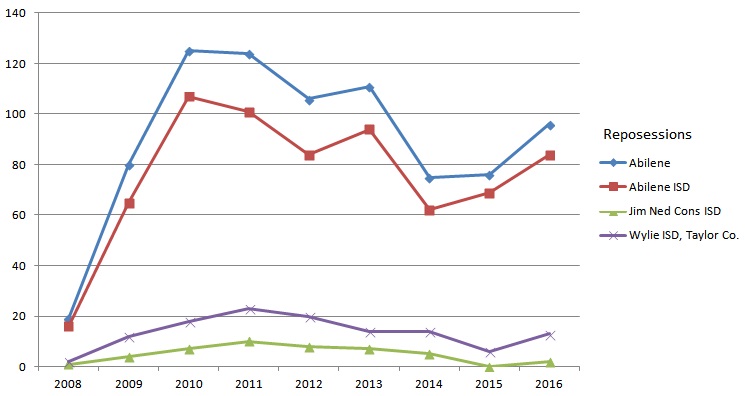
- 96 lender/repossession sales took place in 2016 in the city of Abilene. WISD and AISD repossessions sold for roughly $35 less than their market average. JNCISD repossessions sold for $72.91 less than their market average – looks like someone got a good property to flip!
To get a sense of how prices have moved across time, price/sqft was adjusted for inflation using the Consumer Price Index (CPI). This makes the gains in price/sqft less dramatic across the last 11 years and reveals the impact of the downturn that began in 2008 without the distortion of inflation.

Reviewing historical days on the market (DOM), we can see that the time homes spend on the market continues to improve. 2011 marked the worst year for days on market; Abilene homes spent an average of 92 days on the market prior to sale in 2011. 2016 homes spent an average of 54 days on the market with a pace that approximates 2006 sales. JNCISD made the best recovery; 2010 days on the market numbered 109, today the average days on the market are 57.

Following the economic events in 2007, we begin our data with builder sales in 2008. Our oil-enabled market began to recover in 2009, slacked three years, and began to grow in 2012 to today.

Repossessions counter-cyclically trended against new home sales; while repossessions grew, builder-sold homes slid. The drop in repossessions in 2014 signaled the steady growth in builder-sold homes. Today, the pace of repossessions seem led by the growth of builder-sold homes.


Leave a Reply