
by John Hill
To ring in 2016, Barnett & Hill brings you 10 years of real estate data on single-family homes sold in the Abilene market. Summary information is cut in a variety of ways and we tried to anticipate what you might find interesting (and if you’d like to see this data tabulated from another direction, please let us know).
A few highlights from 2015:
- 1039 homes sold in AISD, 604 sold in WISD. 1661 sold in Abilene (and if you’re trying to reconcile the math, remember Eula ISD, Jim Ned ISD, Clyde ISD and Hawley ISD also serve homes in Abilene).
- The most expensive 2015 sale in Abilene took place in WISD, zip code 79606 and sold for $1.1 million.
- With 1,661 homes sold, 2015 had the greatest number of sales when compared to performance over the last 10 years. The next-best year occurred prior to the 2008 mortgage-debt crisis where 1,638 homes were sold.
- The average Abilene list price was $167,187 and the average Abilene close price was $162,788 – a difference of $4,399 or a 2.6% discount on list price. On average, sellers conceded $1,725 for repairs or home warranties on 2015 sales resulting in a total concession of $6,124 to the buyer.
- The 2015 sale with the greatest square footage measured 6,665.
- Wylie homes sell for more per square foot. Price/sqft for a WISD home is $107.90; price/sqft in AISD is $71.28.
- One can’t take price/sqft by school district in isolation – Wylie homes sell for more because, on average, they are newer. The average WISD sale is 13 years old, the average AISD sale is 48 years old – a difference of 35 years.
- The average WISD home is 306 sqft larger than the average AISD home. Again, the age of the inventory in the two school districts help explain this – homes have grown larger across time.
- When compared to the last seven years, builder-sold were at the greatest size, measuring 2,082 sqft..
- Homes in 79603 sold for the lowest price/sqft at $55.13. Homes in 79606 had the most expensive price/sqft at $97.94 (barely edging 79602 at a price/sqft of $97.23).
- Homes in AISD sold 8 days faster than homes in WISD. With the exception of 2014, this has held true for the last 10 years.
- Builder-sold homes in WISD measured 2,196 sqft. Builder-sold homes in AISD were 584 sqft smaller at 1,612 sqft.
- Lender sales were at a 7-year low in 2015 and tied with 2014 at 111 lender-initiated sales.
- Lender sales in AISD sold roughly $30/sqft less than the AISD market as a whole. Lender-owned sales in WISD sold roughly $20/sqft less than the WISD market as a whole.
To get a sense of how prices have moved across time, price/sqft was adjusted for inflation using the Consumer Price Index (CPI). This makes the gains in price/sqft less dramatic across the last 10 years and reveals the impact of the downturn that began in 2008 without the distortion of inflation.
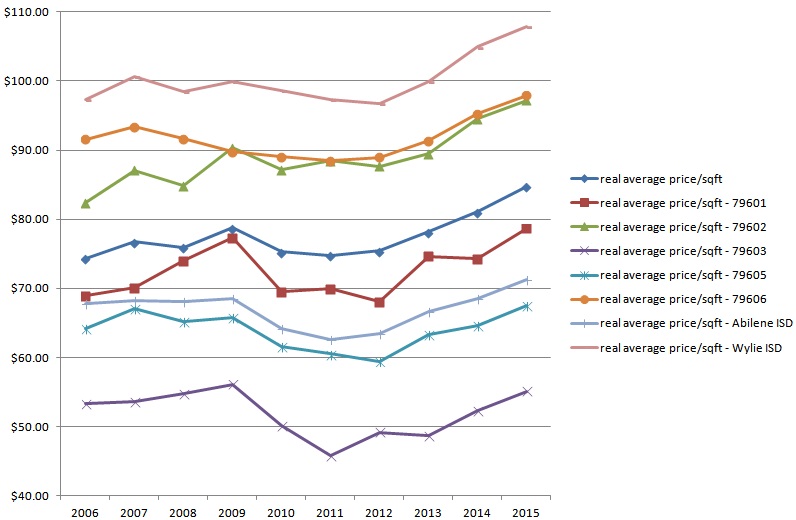
A few observations about the last 10 years:
- ZIP codes from lowest to highest in terms of price/sqft: 79603, 79605, 79601, 79602, 79606
- Northside (79601, 79603) ZIP codes climb between 2006 to 2009 when southside ZIP codes (79602, 79605 and 79606) began to feel the impact of the mortgage debt crisis and national economic downturn.
- After 2007, price/sqft for homes in 79606 decline until 2011.
- With the exception of homes in 79602, price/sqft fell townwide between 2009 to 2011.
- Southside (79602, 79605, 79606) ZIP codes demonstrated a steady recovery after 2012. Northside ZIP codes (79601, 79602) recovered across the same period, but with setbacks to price/sqft (79601 in 2014; 79603 in 2013).
Leave a Reply