Each year, we obtain public records through Taylor CAD to assess ownership of rentals in the Abilene real estate market. Part of this analysis allows us to identify which property owners have the strongest presence among Abilene landlords. Too, this data, in tandem with market information about rental prices, allows one to assess the impact of single-family rental units on the local Abilene economy.
9,619 property records were provided by Taylor CAD for this analysis. When requesting this data from Taylor CAD, we asked for records of non-homesteaded properties that had a residential use. It is our assumption that these properties would be used for residential leasing and we do not attempt to differentiate motives for holding residential property without a homestead exemption beyond this single use.
For each rental in the Wylie ISD, there were 9 rentals in AISD – 89.1% of area rentals are in AISD and 10.8% are in Wylie ISD. To restate in terms of unit count: there are 8,569 rentals in AISD and1,043 rentals in WISD. The fraction of a percent of non-WISD, non-AISD homes are those in other districts, e.g. Eula ISD, that fall within Abilene’s city limit.
A variety of zoning classifications were included in this data set, but, as one would expect, the preponderance of records were for structures zoned RS-6, RS-8, and RS-12. These designations deal with lot size – RS-6 is minimum 6,000 sf, RS-8 is a minimum 8,000 sf, and RS-12 is minimum 12,000 sf in size. While the square footage of each home provides a straightforward indication of the home’s value, lot size (with the exception being patio homes or town houses which carry their own zoning designation) serves as a proxy for home value. 61.7% of the homes assessed were zoned RS-6, 9.5% were zoned RS-8 and 2.0% were zoned RS-12. 15.7% were zoned MD or Residential Medium Densitya designation which permits 12 structures per acre. Only three rentals possesed a PH patio home designation. The 11.1% balance carryed other, atypically residential classifications. A complete list of zoning classifications can be seen in the City of Abilene Land Development Code on page 16.
A comparison of AISD and WISD reveals differences in the two districts and much of this is based on property age. Overall, Abilene single-family rentals have an average year built of 1931. When the market is separated into WISD and AISD properties, WISD homes have an average year built of 1987 and AISD homes have an average year built of 1925. One should note that some years seem incorrect and appear to be entered as place-holders; for example, the average year built of the 30, single-family rentals owned by Hardin-Simmons University is 1880 – a date that predates founding by 13 years.
In terms of built square footage, Abilene area homes measure 1341 square feet. When separated by district, AISD homes measure 1,303 sf and the typically newer Wylie ISD homes measure 1,649 sf.
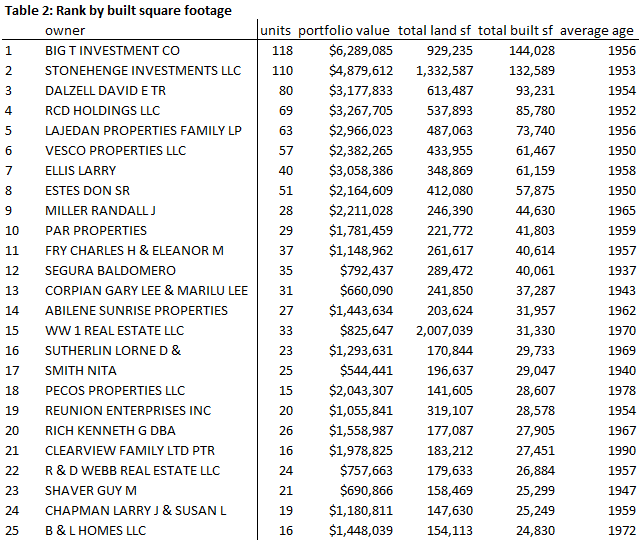
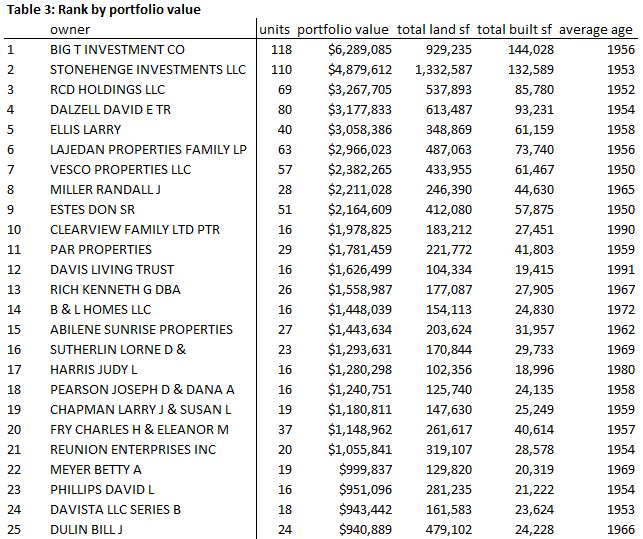
Owners were summarized by total value of all properties owned, total built square footage of properties owned, total land square footage of properties owned, number of units owned by the individual and the average age of the properties owned and then ranked. The list of owners is long – there are 5,485 distinct landlords identified in this data set. This is an increase by 131 over the 5,354 observed landlords last year. The typical Abilene landlord owns a two-house porfolio valued at $113,511 with 2,351 square feet under ownership. For this reason, we will limit our report to the top 25 landlords with regard to (1) unit count, (2) built square footage and (3) appraised value. We also limited the list to individuals – Abilene Christian University, Hardin-Simmons Univeristy, Hendrick Hospital, Abilene Housing Authority and Sears Methodist were represented on this list, but removed. The results are summarized in the three tables that follow:


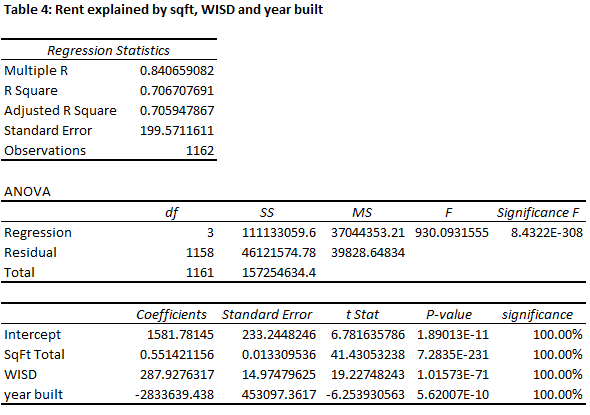
For the last several years, Barnett & Hill has compiled rental rates for the Abilene market. This information, in tandem with these tabulations, can be used to estimate rental income by landlord and make an annual estimate of the overall contribution by single-family rental units to the local economy. The data from Taylor CAD does have limitations, but it captures three, significant variables that are predictive of local rents: square footage, property age, and school district. 365 days of NTREIS data from March 25, 2014 to March 25, 2015 were used to estimate an OLS regression that explains monthly rent as a function of these three variables. The results of this regression are in Table 4:

Interpretation of parameters for square footage and WISD makes intuitive sense; each square foot adds 55¢ in rent/mo and a home in WISD rents for $287.93 more than a home in AISD. The parameter for age is not as straighforward. The reciprocal of year built was used to estimate rent because this transformation allows one to show that new homes rent for top price and then quickly lose their luster (and rent) as they approach their 10th year. On the other hand, there is very little difference in rent, ceteris paribus, for homes with a 10-year spread in age between 60 to 70 years of age.
Based on parameters that control for age, square footage and school district, it is estimated that Abilene single-family rentals have the potential to generate $101,907,650 each year for the local economy – not quite Dyess AFB, but certainly nothing to disdain. We elected not to make public revenue estimates at the owner level – publishing public records regarding property is one thing, but taking it one step further with revenue estimates is a bit bold.

Leave a Reply